

Research firms put the global animation market at roughly $450 billion in 2026, with forecasts running past $580 billion by 2030. At the same time, one third of Animation Guild members were laid off in a single year, California lost 30% of its film, television and sound jobs, and global kids TV commissions fell 18%.
Both things are true. They are not measuring the same thing.
Most animation market estimates bundle software licences, hardware, video games and streaming advertising into one number. That figure grows when Adobe sells more seats or a game studio ships a title. It does not track how many animators are working. We have separated those two stories in this article, and sourced every figure to the organisation that published it.
Key Takeaways
- The animation market is measured in tools and rights revenue. The animation industry is measured in people. The first is growing fast. The second is barely moving, and what little growth it has is concentrated in staff jobs rather than the freelance majority. Software alone accounts for 53.76% of the 3D animation market.
- US animators earn a median of $102,030, and 61.5% of them are self-employed. The Bureau of Labor Statistics projects just 2% job growth through 2034, roughly 900 additional jobs.
- Market-size estimates are not consensus figures. Four research firms put the global animation market between $371 billion and $472 billion for overlapping years. Treat any single headline number as an estimate, not a fact.
- AI did not cause the animation job losses, according to the economic data. Executives expected it to in 2024. The jobs disappeared. But the roles most exposed to AI grew in number over the same period the losses hit, which does not fit an AI-displacement story.
- Animation now leads both the box office and streaming. Animated films took the top two worldwide slots in 2025, and an animated kids series was the most-streamed title in the United States for a second consecutive year.
Content
What the “$450 Billion Animation Market” Actually Measures
The headline animation market figure counts software, hardware, video games, streaming advertising and ticket sales alongside animation production. It is a measure of an economic ecosystem, not of animation work.
This matters because the number gets quoted as evidence the industry is booming, while the people who make animation report the opposite. Reading the publishers’ own scope tables resolves the contradiction.
1. The global animation market is estimated at $449.78 billion in 2026, up from $420.73 billion in 2025, according to The Business Research Company. Its forecast reaches $580.11 billion by 2030 at a 6.6% compound annual growth rate.
2. Four research firms place the global animation market between $371 billion and $472 billion for overlapping years. The estimates are not consistent with each other, and no two use the same scope.
| Publisher | Estimate | Forward projection | CAGR |
|---|---|---|---|
| The Business Research Company | $420.73B (2025), $449.78B (2026) | $580.11B by 2030 | 6.6% |
| Precedence Research | $462.32B (2025) | $953.31B by 2035 | 7.52% |
| market.us | $472.2B (2025) | $905.4B by 2034 | 7.5% |
| Zion Market Research | $371.21B (2023) | $580.82B by 2032 | 5.1% |
3. Software accounts for 53.76% of the 3D animation market, according to Grand View Research. More than half of that “animation market” is licence revenue from tools, not payment for animation work.
Healthcare and medtech brands often use 3D medical animation to explain procedures or mechanisms that live footage cannot show clearly.
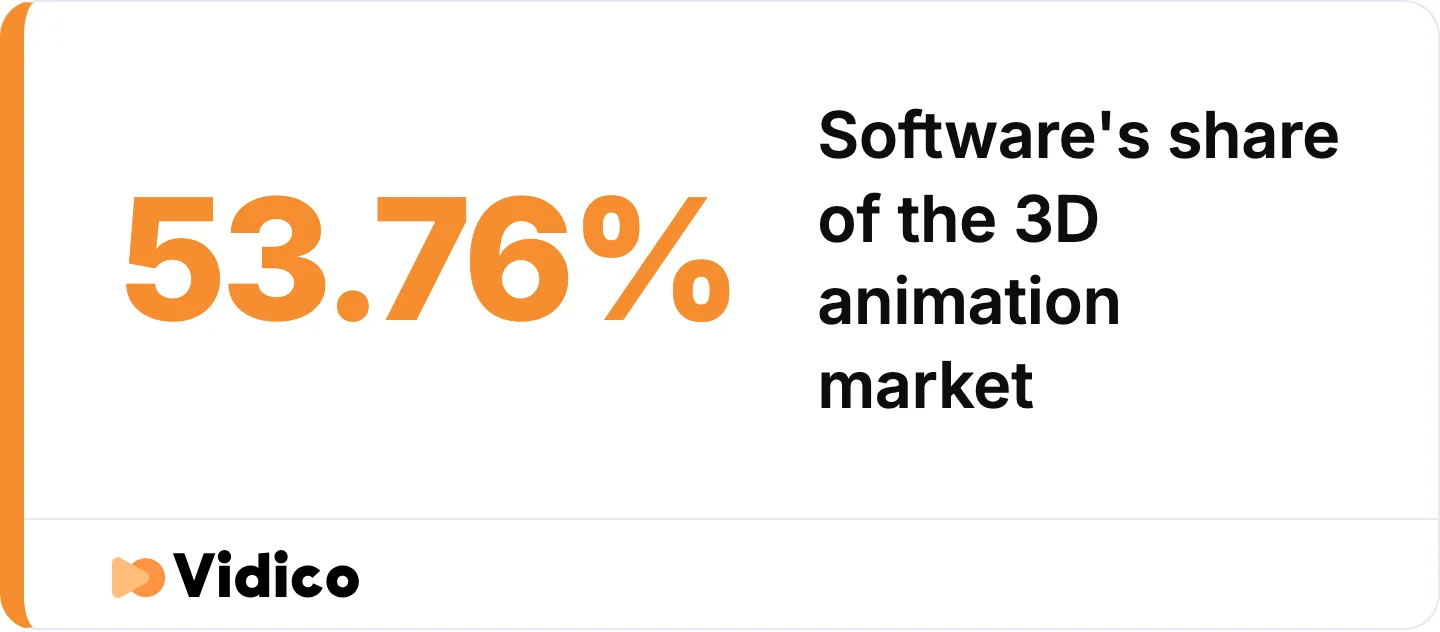
More than half of the measured 3D animation market is tool licence revenue, not payment for animation work. Source: Grand View Research.
4. Three of the four major animation market-size estimates bundle video games into the market, and two include advertising. The Business Research Company books over-the-top streaming revenue, advertising and cinema ticket sales as animation revenue streams.
5. Adobe, Autodesk, NVIDIA, Maxon and Toon Boom are named as key companies in animation market-size reports. They are software and hardware vendors. Their growth raises the animation market figure without employing a single additional animator.
6. Roughly 84% of animation and visual effects firms use open-source software, according to an Academy Software Foundation study cited by Zion Market Research. Licence-revenue growth and production-tool adoption are not the same curve.
Every animation market-size estimate available comes from a commercial research publisher, not a government or academic body. We present them as what research firms estimate, with the range, rather than as an established figure.
Animation Market Size Statistics
7. The 3D animation market was valued at $22.67 billion in 2023 and is projected to reach $51.03 billion by 2030, growing at 12.3% annually, per Grand View Research. That is the fastest-growing major segment.
8. 3D modelling accounts for 30.2% of 3D animation revenue, with media and entertainment representing 34.53% of end use and North America holding 36.9% of the market, per Grand View Research.
Product teams often turn to 3D product animation services to show how something works before a prototype exists.
9. The global visual effects market reached $11.4 billion in 2025 and is forecast to hit $19.4 billion by 2034 at a 6.11% compound annual growth rate, according to the IMARC Group. Two firms independently landed within 2% of each other on the 2025 figure.
10. Generative AI in animation is projected to grow from $2.37 billion in 2025 to $9.28 billion by 2030, a 30.2% compound annual growth rate, per a Research and Markets forecast.
11. Base-year estimates for the generative AI animation market span $1.3 billion to $8.9 billion, roughly a sevenfold spread for that same named market in adjacent years. Published CAGRs for it range from 30% to 40%. The segment is real, but it is not yet measured consistently.
12. Media and entertainment, gaming and education are the three largest end-use sectors, at roughly 30%, 24% and 17% of the market respectively, per market.us and The Business Research Company. North America holds approximately 35% of global animation and visual effects revenue, and 3D accounts for around 45% of the market by product type.
Animation Employment and Salary Statistics
The Bureau of Labor Statistics is the only government body publishing animator employment and wage data at this level of detail. It is the strongest data on this page.
13. US special effects artists and animators earn a median annual wage of $102,030, according to the Bureau of Labor Statistics Occupational Employment and Wage Statistics for May 2025. The widely quoted $99,800 figure is the May 2024 median and is one survey year out of date.
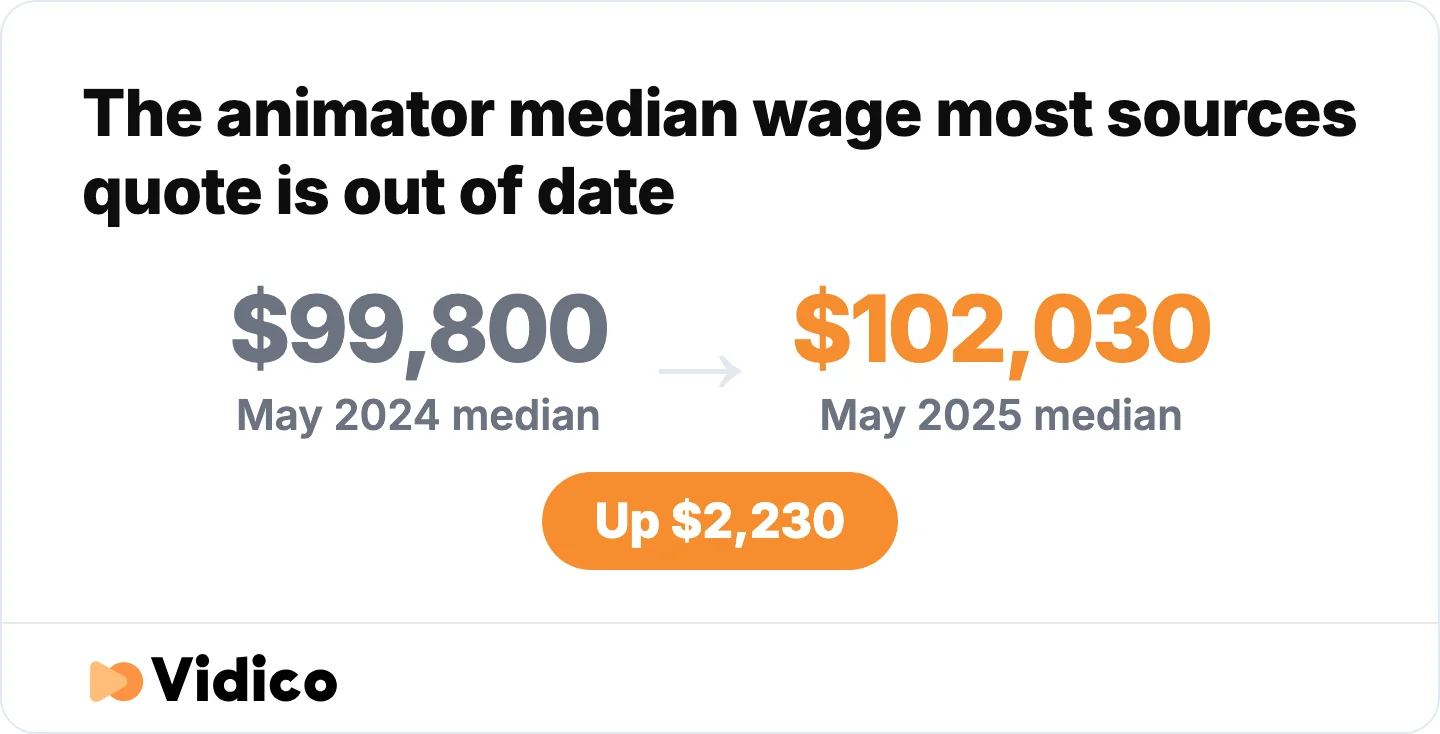
The widely quoted $99,800 median is a year out of date. Source: US Bureau of Labor Statistics, Occupational Employment and Wage Statistics.
14. The mean annual wage for US special effects artists and animators is $112,870, higher than the median, which indicates a group of high earners pulling the average up.
15. Animator pay spans $58,600 to $177,110 across the wage distribution.
| Percentile | Annual wage |
|---|---|
| 10th | $58,600 |
| 25th | $75,490 |
| 50th (median) | $102,030 |
| 75th | $139,130 |
| 90th | $177,110 |
16. There are 19,970 wage-and-salary animator jobs in the United States, per BLS Occupational Employment and Wage Statistics for May 2025. This counts employees only.
17. Total US animator employment is 57,100 when self-employed workers are included, according to the BLS Occupational Outlook Handbook. The gap between 57,100 and 19,970 is not a contradiction. It is the freelance workforce.
18. 61.5% of US animators are self-employed. BLS Employment Projections put 35,200 of 57,100 animators outside traditional employment in 2024. Animation is majority freelance work.
19. BLS projects 2% employment growth for animators between 2024 and 2034, an increase of about 900 jobs. That is slower than the average across all occupations.
20. About 5,000 animator openings are projected each year over the decade, most of them replacing workers who move to other occupations or retire.
21. Self-employed animator numbers are projected to fall 3.4% by 2034 while wage-and-salary positions rise 9.6%, per BLS Employment Projections. The mix is shifting toward staff roles even as the total barely moves.
22. Software publishers pay animators the most among major employing industries, at a mean of $132,190. Broadcasting and content providers follow at $128,070.
| Industry | Animators employed | Mean annual wage |
|---|---|---|
| Motion picture and video | 5,910 | $116,410 |
| Software publishers | 3,920 | $132,190 |
| Computer systems design | 2,020 | $107,090 |
| Performing arts and spectator sports | 1,170 | $110,040 |
| Advertising and public relations | 1,010 | $91,490 |
| Broadcasting and content providers | 550 | $128,070 |
| Educational services | 540 | $67,220 |
23. Motion picture and video is the largest employer of animators at 5,910 jobs, followed by software publishers at 3,920. Games and software now employ nearly as many animators as film and television.
24. Animators earn roughly twice the median for all US occupations. The all-occupations median was $49,500 as of May 2024, and the art and design worker median was $53,180.
Animator Pay Around the World
Only two countries publish per-worker animation pay data. Most do not, and several widely circulated regional figures have no traceable source.
25. Japanese animation workers earn a mean annual income of ¥4.446 million, with a median of ¥4.0 million, according to the Japan Animation Creators Association survey of 983 animation workers published in March 2026. The survey was funded by Japan’s Agency for Cultural Affairs.
26. Entry-level in-between animators in Japan average ¥2.275 million a year, roughly US$15,000. That is the lowest-paid role in the survey.
27. Japanese animation directors average ¥7.338 million, chief animation directors ¥7.011 million and key animators ¥4.152 million, per the Japan Animation Creators Association.
| Role | Mean annual income |
|---|---|
| Director | ¥7.338M |
| Chief animation director | ¥7.011M |
| Storyboard artist | ¥6.401M |
| Animation director | ¥5.215M |
| Key animator | ¥4.152M |
| 3DCG artist | ¥3.472M |
| In-between animator | ¥2.275M |
28. Japanese animation workers average 190.6 working hours a month and 7.24 days off, per JAniCA. Both improved slightly from the association’s previous survey.
29. South Korea’s animation industry employed 6,417 people in 2023 against industry sales of ₩1.1 trillion, per Ministry of Culture, Sports and Tourism figures compiled from Korea Creative Content Agency data. The government target is 9,000 workers by 2030.
30. Animation accounts for 0.7% of South Korea’s total content industry but grew 23% year over year, one of the faster-growing segments in a ₩157.4 trillion sector.
31. UK animation supported 1,550 direct full-time equivalent jobs and £100.7 million in direct gross value added, per the British Film Institute Screen Business analysis. A later BFI edition found every £1 of animation tax relief generates £4.53 in additional gross value added. Both figures predate the current contraction, and the BFI does not isolate animation as a standalone employment category in its newer work.
32. No European Union-wide animator employment or wage figure is published. Animation is not reported as a standalone employment category in EU production data. Canada’s producers association reports total production volume, CAD $10.17 billion in its most recent profile, but does not break out animation as a separate category in either dollars or jobs. China publishes no official animation output-value series at all.
| Country | What is published | Latest figure |
|---|---|---|
| United States | Employment and full wage distribution | 57,100 animators, $102,030 median |
| Japan | Per-worker income by role | ¥4.446M mean income |
| South Korea | Employment and industry sales | 6,417 employees, ₩1.1 trillion |
| United Kingdom | Tax-relief-supported FTEs and gross value added | 1,550 FTEs, £100.7M direct GVA |
| European Union | Production volume only | No employment figure published |
| Canada | Sector-wide production volume only | No animation category reported |
| China | Production approvals only | No output-value figure published |
Naming those gaps is more accurate than filling them. Several regional animation employment figures circulating online, including commonly repeated numbers for the EU, Latin America and Canada, trace back to no published source.
Animation Job Losses and Industry Contraction
This is the part of the story the market-size figures hide. Every figure in this section comes from a government body, a union, a production-tracking authority or a research firm measuring commissions.
33. California’s creative economy lost 114,000 jobs between 2022 and 2025, a 14% decline. Film, television and sound employment fell 30% and traditional media fell 34%, according to Otis College of Art and Design research with Westwood Economics, released April 2026.
34. One third of The Animation Guild’s working members were laid off in a single year, the union disclosed in July 2024 based on internal surveys, as reported by TheWrap. Guild membership exceeds 6,000.
35. Global kids TV commissions fell 18% in volume between April 2025 and March 2026, per Ampere Analysis data reported by Kidscreen. Kids commissions had already dropped 22% during 2025.
36. Los Angeles recorded 19,694 shoot days in 2025, down 16.1% from 2024. It is the lowest annual total outside the 2020 shutdown year, according to FilmLA, the region’s official production-tracking body.
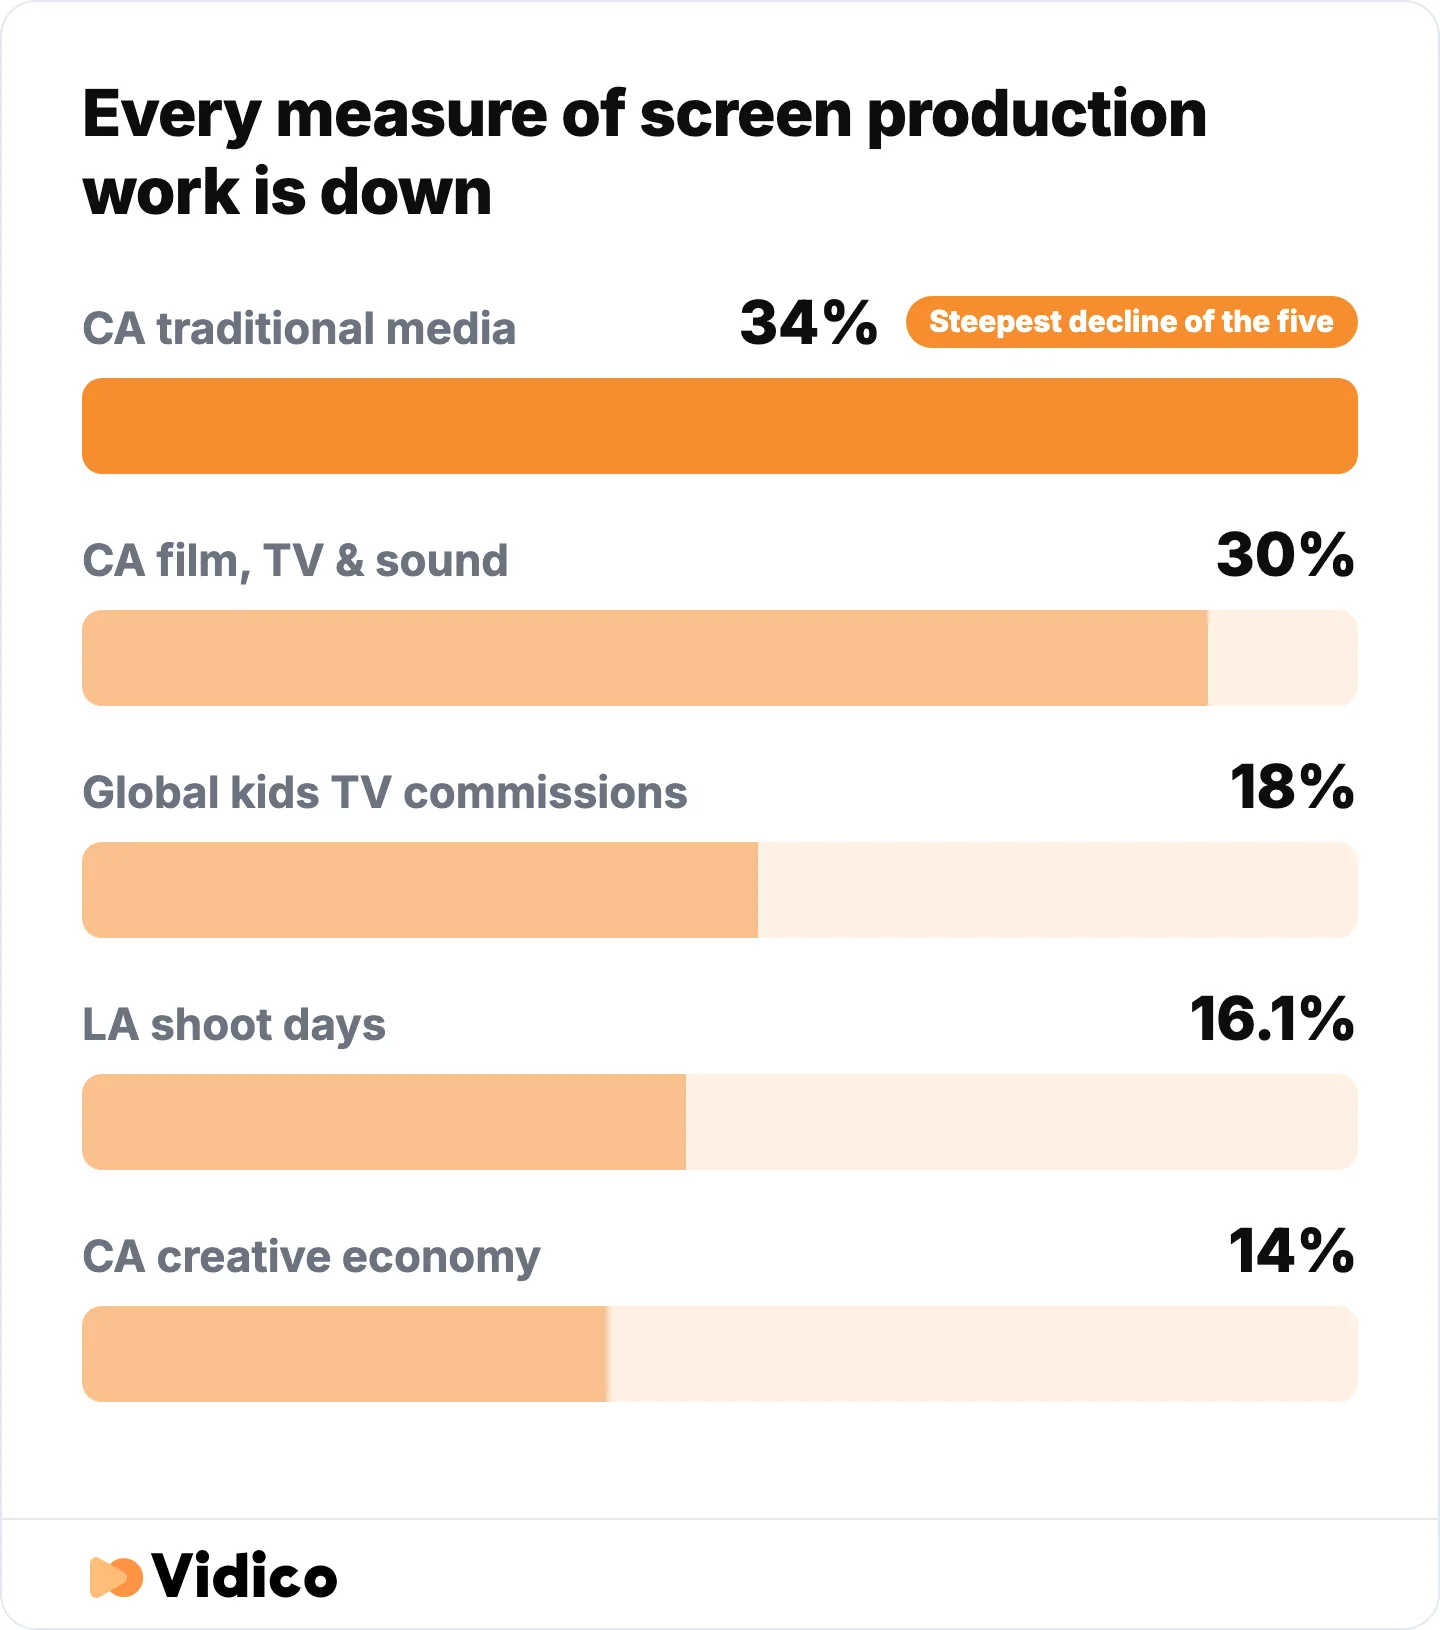
Traditional media in California fell hardest of the five measures. Sources: Otis College of Art and Design with Westwood Economics, Ampere Analysis via Kidscreen, FilmLA.
37. Television filming in Los Angeles ended 2025 at 50.1% below its five-year category average, per FilmLA. Animation is largely not location-shot, so treat this as a measure of the surrounding production economy rather than of animation specifically.
38. Named studio animation cuts since 2023 total well over 1,000 roles.
| Studio | Cut | Date |
|---|---|---|
| Disney (companywide) | ~1,000 employees, with Marvel’s visual development team nearly eliminated | April 2026 |
| Pixar | 175 workers, 14% of the workforce | 2024 |
| Netflix feature animation | ~50 employees, one third of the division | November 2023 |
| DreamWorks Animation | ~70 employees | October 2023 |
| Aardman Animations | just under 5% of staff | 2024 |
The Disney reduction was reported by Forbes, which attributed it to a reduced Marvel slate and cost-cutting. The Pixar and Aardman figures come from Screen Daily, and the DreamWorks figure from Kidscreen.
39. Animation writers work to a minimum of $2,126 a week against $4,515 for writers covered by the Writers Guild agreement. Animation scale is less than half, per TheWrap.
AI in Animation: What the Data Actually Shows
The honest answer to “will AI replace animators” runs in three steps, and the third step contradicts the first two.
40. Executives expected 204,000 US entertainment jobs to be disrupted by 2026, including 62,000 in California, according to Future Unscripted, a CVL Economics study commissioned by The Animation Guild and three other industry groups and published January 2024. It surveyed 300 industry leaders.
41. 21.4% of US film, television and animation jobs, roughly 118,500 positions, were expected to be consolidated, replaced or eliminated by 2026, per CVL Economics.
42. 29% of animation jobs specifically were identified as disruptable in the CVL Economics study.
43. 78% of entertainment companies in animation had adopted or planned to adopt AI, per CVL Economics. Nearly half expected generative AI to produce 3D assets and realistic sound design within three years.
44. The jobs disappeared, but the economic data says AI did not cause it. Otis College researchers found that “the pattern of job loss in terms of the types of jobs being lost and when they’re being lost does not support the fact that there’s been displacement of workers by AI,” as reported by The Hollywood Reporter. The roles most exposed to AI, including writers, software developers and artists, grew in number. The identified causes were cost-driven displacement of lower-paying roles and structural change.
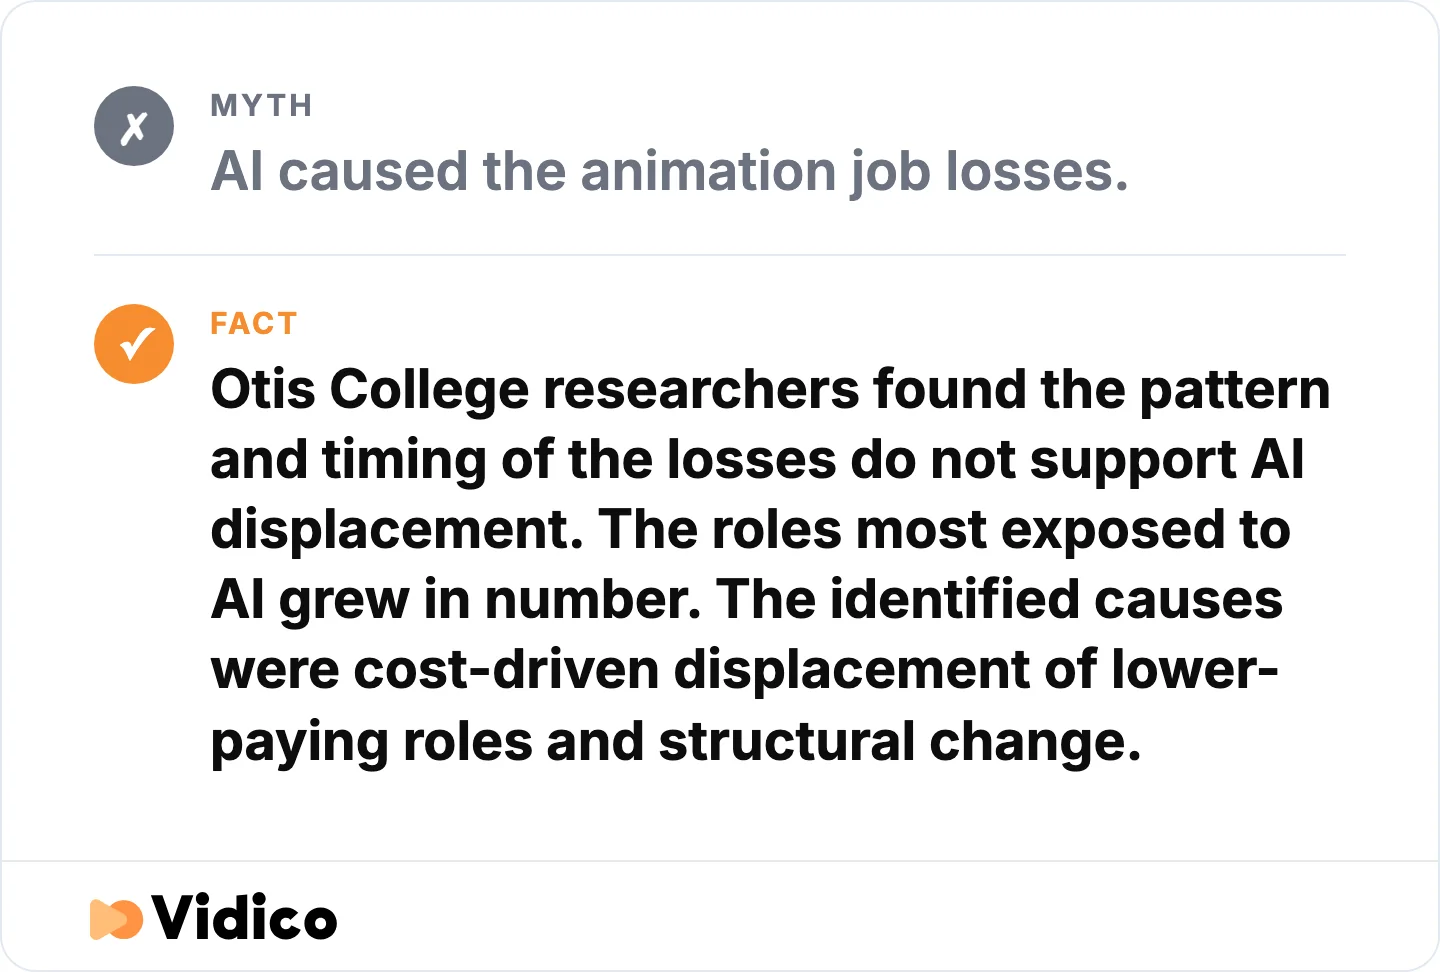
Jobs disappeared, but the pattern does not fit AI displacement. Source: Otis College researchers, reported by The Hollywood Reporter.
45. The Animation Guild ratified its 2024 to 2027 contract with 76.1% in favour, securing AI protections that prevent AI-generated work from undermining member pay or credit, plus studio notification obligations. Members did not win the right to opt out of using AI, or to opt out of having their work used to train AI. The union’s master agreement is the primary document.
46. Only 29% of B2B tech marketing teams have a formalised AI governance policy, with nearly half still building one, according to our 2026 State of Creative in Tech report, a survey of 230-plus marketing leaders. Accuracy is the top-ranked AI risk concern among them.
47. B2B tech marketing buyers report AI is most useful mid-process, in editing and repurposing existing assets, while the brief and the final output stay human. Final copy is the single most protected output from AI, per our 2026 State of Creative in Tech report.
Box Office Statistics
48. Ne Zha 2 grossed $2,267,446,370 worldwide, making it the highest-grossing animated film of all time and the first animated film past $2 billion, per Box Office Mojo. Xinhua reported its China run drew 324 million admissions.
49. Ne Zha 2 ranks fourth among all films ever released worldwide, as of July 2026, behind Avatar, Avengers: Endgame and Avatar: The Way of Water. Its margin over Titanic is under $3 million, and Titanic re-releases periodically.
50. Zootopia 2 grossed $1,866,647,950 worldwide, with 77.1% of that from international markets. Disney calls it the highest-grossing animated film from an MPA studio.
51. Inside Out 2 grossed $1,698,863,816, ranking third among animated films.
| Film | Worldwide gross |
|---|---|
| Ne Zha 2 | $2,267,446,370 |
| Zootopia 2 | $1,866,647,950 |
| Inside Out 2 | $1,698,863,816 |
| The Lion King (2019 CGI remake) | $1,662,020,819 |
| Frozen II | $1,453,683,476 |
52. Three of the ten highest-grossing films of 2025 were animated, and animation took both the number one and number two slots. Demon Slayer: Infinity Castle took seventh with $793,498,985.
53. Animated films hold two of the top three worldwide slots in 2026 to date. Super Mario Galaxy Movie leads with $1,010,692,491 and Toy Story 5 sits third at $957,537,644. Toy Story 5 opened to $160 million domestically, the second-largest animated opening on record.
54. Global box office reached $33.5 billion in 2025, with North America contributing $8.87 billion, up 1.5%, per Gower Street Analytics and Comscore figures reported by Screen Daily. Domestic admissions fell 4.9% to 780 million.
55. Walt Disney Studios led 2025 studio rankings with $6.58 billion globally, including $2.49 billion in the US and Canada, roughly 28% of that market. It was Disney’s ninth studio-ranking win in ten years.
No publisher currently reports animation’s share of total box office as a percentage. The genre and production-method market-share tables that once carried it have been removed. We have not published a percentage rather than construct one.
Streaming and Distribution Statistics
56. An animated children’s series was the most-streamed title in the United States in 2025. Bluey drew 45.2 billion viewing minutes on Disney+, beating every drama, prestige original and film, according to Nielsen. It was the second consecutive year an animated title took the top spot.
57. Audiences streamed 16.7 trillion minutes in 2025, up 19% from 14 trillion in 2024, per Nielsen’s US streaming measurement.
58. KPop Demon Hunters drew 20.6 billion minutes as the top kids movie of 2025, per Nielsen.
59. Six of the twenty most-streamed titles in the first half of 2025 were animated: Bluey, Family Guy, Bob’s Burgers, SpongeBob SquarePants, American Dad! and South Park.
60. Streaming reached 47.5% of all US television viewing in December 2025, the highest share Nielsen has recorded. Nielsen’s Gauge reports by platform rather than genre, so it does not isolate animation.
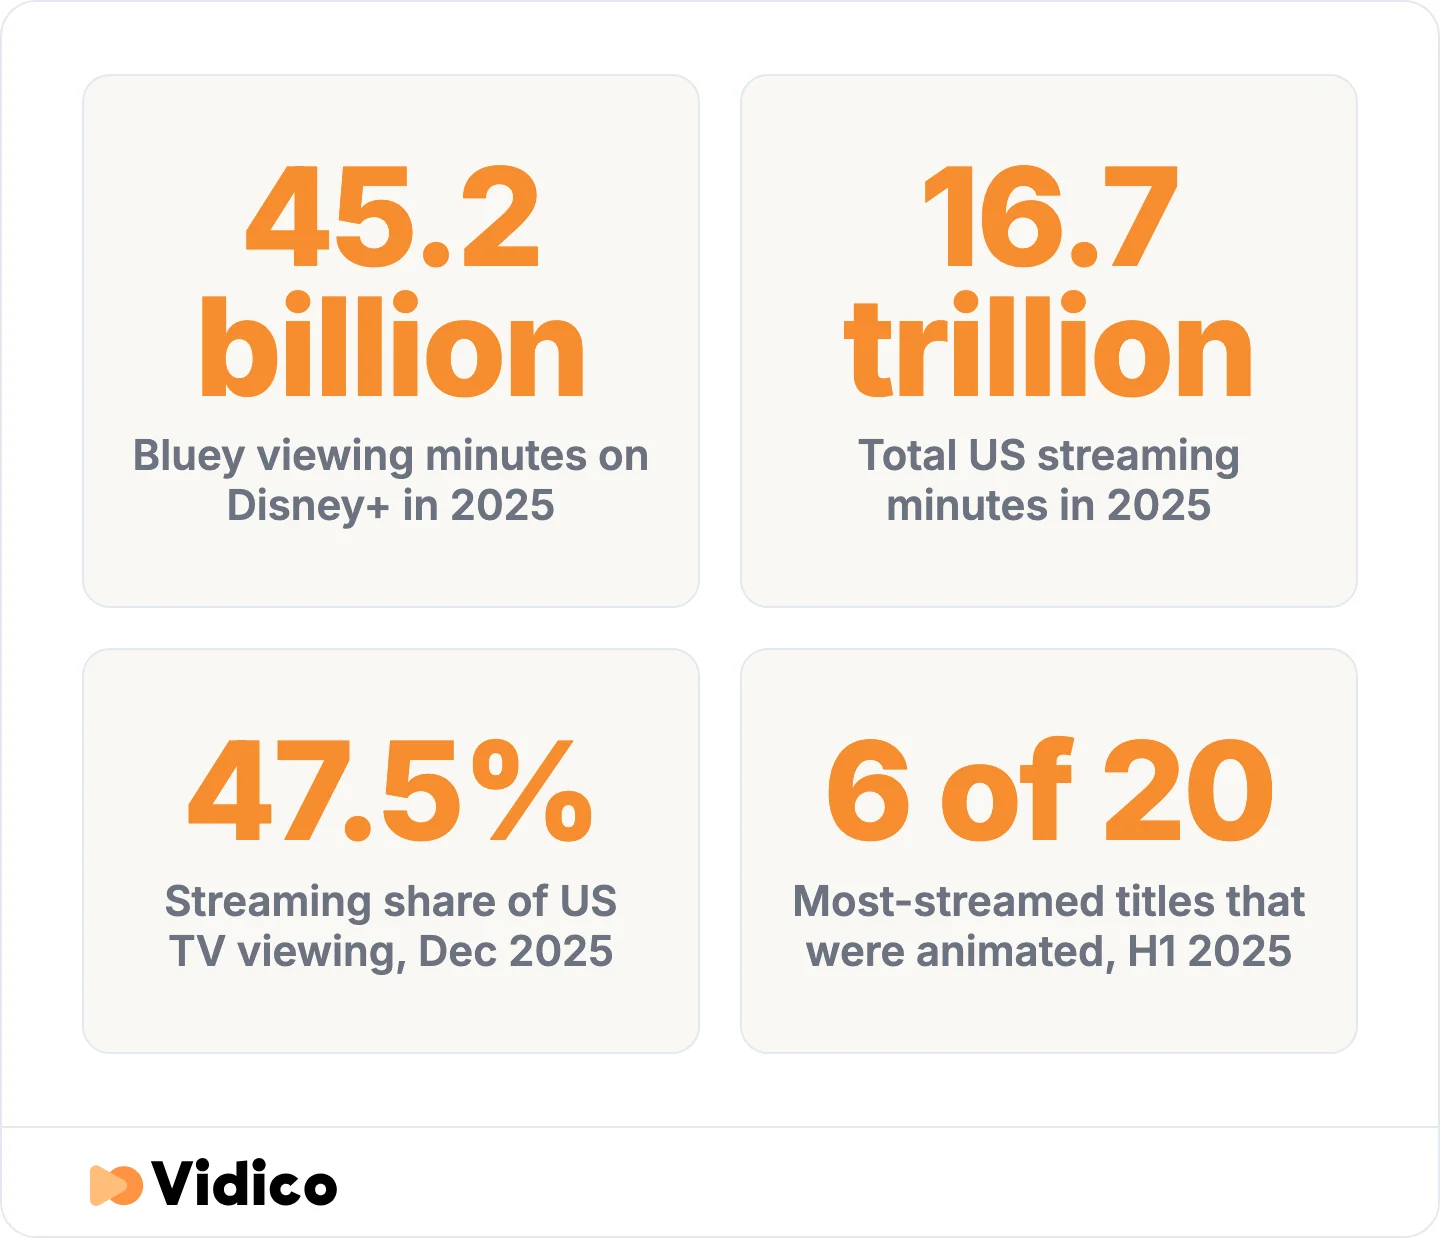
Animation leads streaming while streaming itself hits record share. Source: Nielsen.
61. Streamers are cutting animation commissioning while animation dominates their viewing. Kids and family content fell to 4% of Netflix’s total commissions in 2024 to 2025, down from 9% in 2022 to 2023, per Ampere Analysis reported by C21Media. Catalogue growth is coming from acquired anime rather than originals.
Regional Market Statistics
62. Japan’s anime industry reached a record ¥3.8407 trillion in 2024, up 14.8%, according to the Association of Japanese Animations. Overseas revenue hit ¥2.1702 trillion, up 26.0%, and now represents 56.5% of the total.
63. Anime production companies capture only ¥466.2 billion of that ¥3.84 trillion, roughly 12%, per AJA’s narrower industry measure. The chain runs from a record ¥3.84 trillion anime industry, to ¥466.2 billion reaching the production companies, to entry-level in-between animators averaging ¥2.275 million a year in the JAniCA survey.
64. China’s broadcast regulator approved 36 domestic TV animation titles totalling 12,661 minutes in January 2025 alone, per National Radio and Television Administration monthly filings. Monthly approvals through 2025 ranged from 21 to 41 titles.
65. No official Chinese animation output-value figure is published. Two mutually contradictory numbers circulate through commercial aggregators. Neither traces to a government or association publication, so we have not cited either.
66. Europe produces around 55 animated feature films and 220 TV animation titles a year, totalling roughly 5,200 episodes and 830 hours, per European Audiovisual Observatory data. France accounts for 35% of European TV animation production and the UK 26%.
67. European animation makes up about 25% of global production and 36% of commercial releases but only 5% of admissions. Roughly 67% of its admissions come from export markets.
68. 42% of European animation titles produced between 2017 and 2024 were international co-productions, against 27% for live action. Animation is the most co-produced format in Europe.
What Marketing Teams Are Doing With Animation
Public animation data covers studios, unions and market analysts. Very little is published about the companies commissioning animated content, so we surveyed them.
69. 76% of B2B tech marketing leaders say their creative production budget is increasing this year, per our 2026 State of Creative in Tech report. 42.7% now allocate 21% to 35% of total marketing budget to creative production.
70. Production capacity and internal approvals are the top two workflow bottlenecks those teams report. Budget is the single biggest constraint at 27.4%, followed by measurement and attribution at 14.1%.
71. Most teams take 4 to 14 days from concept to live, while teams with reusable asset systems ship in 1 to 3 days. Only one in three has a fully reusable asset system.
At Vidico, we produce explainer and animated video for B2B SaaS and tech brands on monthly plans rather than per-project quotes, and we build a reusable template library for each brand so later projects ship faster than the first. EverString’s animated explainer work drew 1.8 million on-site views with 82% viewer retention and a 27% increase in customer signups. Easy Agile’s motion graphics won a Gold MUSE Award and delivered four times the industry-average click-through rate.
If you are planning animation work this year, our animation video production service page covers formats and process, and how much animation costs breaks down budget ranges by style.
If you are shortlisting vendors, start with our list of animated video production companies.
FAQs
Is the animation industry growing?
The animation market is growing while animation employment is not. Research firms estimate the global market at roughly $450 billion in 2026, growing 6% to 7% annually, but those figures include software, hardware, gaming and advertising revenue. Measures of animation work point the other way: global kids TV commissions fell 18% between April 2025 and March 2026, California film, television and sound employment fell 30% between 2022 and 2025, and one third of Animation Guild members were laid off in a single year.
Which country is number one in animation?
Japan has the largest dedicated animation industry, reaching a record ¥3.8407 trillion in 2024 with overseas revenue of ¥2.1702 trillion. The United States leads on studio box office, with Walt Disney Studios taking $6.58 billion globally in 2025. China produced the highest-grossing animated film ever in Ne Zha 2 at $2.27 billion. Which country ranks first depends on whether you measure industry revenue, studio share or individual film performance.
Is animation a good career in 2026?
The pay is strong and the growth is slow. US animators earn a median of $102,030, roughly double the all-occupations median of $49,500, and about 5,000 openings are projected each year. But the Bureau of Labor Statistics projects only 2% employment growth through 2034, about 900 additional jobs, and 61.5% of US animators are self-employed rather than salaried. In Japan, entry-level in-between animators average ¥2.275 million a year, around US$15,000.
Will AI replace animators?
The available economic data says AI has not been the cause of animation job losses so far. Industry executives expected significant displacement: a 2024 study commissioned by The Animation Guild found 29% of animation jobs were considered disruptable and 78% of animation companies had adopted or planned to adopt AI. Jobs did disappear. But Otis College researchers analysing California’s 2022 to 2025 losses concluded the pattern and timing of those losses do not support AI displacement, and found that the roles most exposed to AI grew in number. Cost-driven cuts and structural change were identified instead.
Is the animation industry saturated?
Entry-level competition has intensified while senior demand holds. The Animation Guild reported one third of its working members laid off in a single year, and named cuts at Disney, Pixar, Netflix, DreamWorks and Aardman total well over 1,000 roles since 2023. At the same time, BLS projects wage-and-salary animator positions to grow 9.6% by 2034 while self-employed roles fall 3.4%, so the contraction is concentrated in freelance work rather than staff positions.
Is animation a risky career?
It is riskier for freelancers than for staff. 61.5% of US animators are self-employed, and BLS projects self-employed animator numbers to fall 3.4% by 2034 while wage-and-salary positions rise 9.6%. The Animation Guild reported one third of its working members laid off in a single year, and named cuts at Disney, Pixar, Netflix, DreamWorks and Aardman total well over 1,000 roles since 2023. The contraction has concentrated in freelance and contract work rather than staff positions.
How much do animators make?
US special effects artists and animators earn a median of $102,030 a year, with the tenth percentile at $58,600 and the ninetieth at $177,110. Pay varies most by industry: software publishers pay a mean of $132,190, broadcasting $128,070, and educational services $67,220. Japan is the only other country publishing per-worker animation income, at a mean of ¥4.446 million.
What percentage of the animation market is software?
Software accounts for 53.76% of the 3D animation market, per Grand View Research. This is the single most useful figure for interpreting animation market-size headlines, because it shows that more than half of the measured “market” is tool licence revenue rather than payment for animation production.
The Bottom Line
The animation industry in 2026 is two stories that get told as one. Market forecasts running from $450 billion toward $580 billion are real, but they measure software licences, hardware, gaming and streaming advertising alongside animation work. The measures that track animation as a craft, including commissions, union membership, shoot days and studio headcount, are contracting.
For anyone reading these numbers to make a decision, the useful figures are the specific ones. US animators earn a median of $102,030 and 61.5% work for themselves. Animated titles took the top two worldwide box office slots in 2025 and the most-streamed title in America two years running. Kids commissions fell 18%. AI, on the evidence available, is not what caused the job losses.
We build B2B explainer and animated video systems for SaaS and tech brands, and we published our own survey of 230-plus marketing leaders because buyer-side data on animation demand barely exists. If you are budgeting animation work this year, our Creative Intelligence Report gives you a free competitive analysis of how your category is using video.
Sources
- The Business Research Company
- Grand View Research
- Zion Market Research
- IMARC Group
- Research and Markets
- US Bureau of Labor Statistics: Occupational Employment and Wage Statistics
- US Bureau of Labor Statistics: Occupational Outlook Handbook
- US Bureau of Labor Statistics: Employment Projections
- Japan Animation Creators Association
- Association of Japanese Animations
- British Film Institute
- National Radio and Television Administration
- Otis College of Art and Design
- The Hollywood Reporter
- TheWrap
- Kidscreen
- FilmLA
- Forbes
- Screen Daily
- CVL Economics: Future Unscripted
- The Animation Guild Master Agreement
- Box Office Mojo
- Screen Daily: North American box office
- Nielsen
- C21Media